Number Theory - SPW% and DE% with Nate Ngo (part 1)
Service Pressure Won and Defense Earned
You’d be hard-pressed to find an American volleyball performance analyst that has been doing the job as long as Nate Ngo has. Not only has he been doing this work on the biggest stages the sport has to offer, he also continues to think deeply and innovate, helping to grow the game in the US. I know that I am indebted to him for his contributions to volleyball analysis. You can read his posts here.
What is Number Theory? - Read here
Over the course of our conversation, Nate talked about both ends of an analytical spectrum, “macro-level” metrics that meld a lot of different situations into one number and metrics that partition data up into much smaller, more descriptive subsections. While both ends of the spectrum have their uses, Nate has been spending some time lately towards the “more partitioned” end of the spectrum. He has been focusing on the different kinds of scoring opportunities that teams create and how well they convert those opportunities into points.
To get into what Nate’s been exploring, I’ll start out at the “macro-level” end of the spectrum and then drill down. One of the most general metrics that describes team defensive success is point scoring percentage (PS%). While there are variations of the calculation, the simplest version look like this.
This measure provides some useful information about how well a team scores when serving. If a team point scores well, it is often assumed that they defend well. But what are they defending well against or scoring well after? PS% is silent on what kinds of chances the serving team creates and that information can be useful, both in-match as well as more long-term.
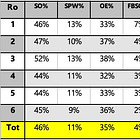
To better understand the kinds of situations a serving team is creating, Nate splits his team’s point scoring data up into different categories based on opponent reception quality. He creates two categories, in-system receptions and out-of-system receptions. It’s commonly assumed that a team would defend and transition at different rates against these two situations so Nate’s metrics are designed to determine if and how a team actually scores against these two situations. As Nate said, “just because you’re creating opportunities doesn’t mean you’re scoring on them.”
When the receiving team is in system, the pressure is much greater on the serving team’s defense if they are to score, so Nate calls the calculation for these cases Defense Earned (DE%). The equation for it looks like this.
The other partition is when the serving team gets the receiving team out of system (poor reception or worse). In these cases, the serve has created good pressure, so Nate calls the calculation for them Service Pressure Won (SPW%). The equation looks like this.
You can see how much DE% and SPW% resemble each other and the original PS% equation but the partitions create opportunities for insight that weren’t available in the original metric. But before moving on to insights, there’s an important tweak that Nate recommends.
If you recognize that receptions of different grades affect the quality of the attacks that follow them, then you can see that it’s important to treat the resulting attack errors differently too. To do this, Nate has a special sub-category of attack errors that complements DE%. When a receiving team is in system, any attack errors that result shouldn’t be credited to any actions of the serving team. If that is the case, then those errors should be removed from consideration in DE%. That means two more equations, one Nate calls First Ball Side Out Errors (FBSOE%) and, using that, a modified version of DE%.
So Nate’s modified DE% looks like this.
Since SPW%, DE%, and FBSOE% are parts of PS%, they can all be put back together to show a team’s overall PS%.
Now that all the formulas have been laid out, part two will dig into how and when they might be used.
Have questions for Nate? You can ask me here or you can contact him on Twitter/X. To read part 2, click the link below.


I think this is a really interesting concept to breakdown point scoring and how the game is being played. For part 2, can you present some sample games with this data? Also, curious if you have thought about breaking it down further to cover where a team is winning in point scoring, is it on first ball or transition opportunities. For example, is the SPW% translating to a higher transition hitting efficiency or not and using that as opportunities to improve in those areas