Number Theory - eV with Chad Gordon (part 3)
Expected Value
This is the third part of eV. Please read parts one and two to better understand what’s being discussed here.
In part one, I explained how Expected Value (eV) can be more intuitive and beneficial than traditional skill performance metrics. Part two showed examples of eV being used to compare expected outcomes to actual outcomes. This part will give an introduction to creating your own eVs.
What is Number Theory? - Read here
In part two, I ended by writing that SO% is an eV. Actually, it’s both a descriptive and a predictive statistic.
So what makes SO%, a descriptive statistic, a probability? The direction you’re looking when you use it. If you’re looking backward, into the past, then SO% describes how often your team sided out. If you’re looking forward, SO% sets your expectation for how likely your team is to side out on any given future opportunity. Looking forward makes SO% the most basic eV for reception.
So before a ball is served, a receiving team’s eV for an upcoming rally is known. But the probability calculation can handle as many conditions as you want to include. Which rotation is the team receiving in? What kind of serve are they facing? Which zone is the serve coming from? Once the ball is served, more inputs can be added. Which zone is the ball going to? Is it in a seam? Where, relative to the passer’s body, is the serve taken? (Naturally, who receives the serve makes a difference too but I won’t dwell on that here because there’s plenty of detail to manage already.) All of these potential inputs help describe the eV of the reception because each of them describe conditions up to the moment of contact. You could construct an eV that describes how likely your team is to win a rally while in rotation 5 and they face a jump float serve from zone 1 to zone 5 and the passer takes the ball to their right.
It becomes clear that, to calculate an eV with any kind of detail, you’ll need some way of storing all that detail about each contact. This is why you won’t typically see homemade eVs from teams that don’t use VS, DV, or something similar. Building equations to calculate eVs in those applications can be time consuming. For instance, one DV formula for the situation described above looks like this.
=<*$$WCz3{AND[~~~RM~~~~15~R,3]}>/<a$$S{;;3;}>
This is actually a fairly simple DV formula because it only involves a single skill with five details added onto it. For the denominator, I used opponent serves against rotation 5 because I am okay with including opponent service errors in my calculation. If you aren’t, then you should change the denominator to count what you are okay with. Many of the formulas I use in my eV calculations are much more convoluted because they involve more than one skill. If you’re interested in seeing more examples of DV formulas, you can email me.
Once you have some eVs calculated, you can start comparing things. If you want to compare how your team sides out when a particular player passes to how they side out in general, you would calculate how often your team sides out when that player receives and compare that to your team’s overall SO%. But eV is also used to compare that player’s actual outcomes to their expected outcomes. To calculate that, you use the same weighted average formula for reception average but using eVs instead of reception grades as coefficients. Using eVs for my team, that equation would look like this.
Subtracting the player’s eV from their SO% gives you their eV+.
Player X’s eV+ = Player X’s SO% - Player X’s eV
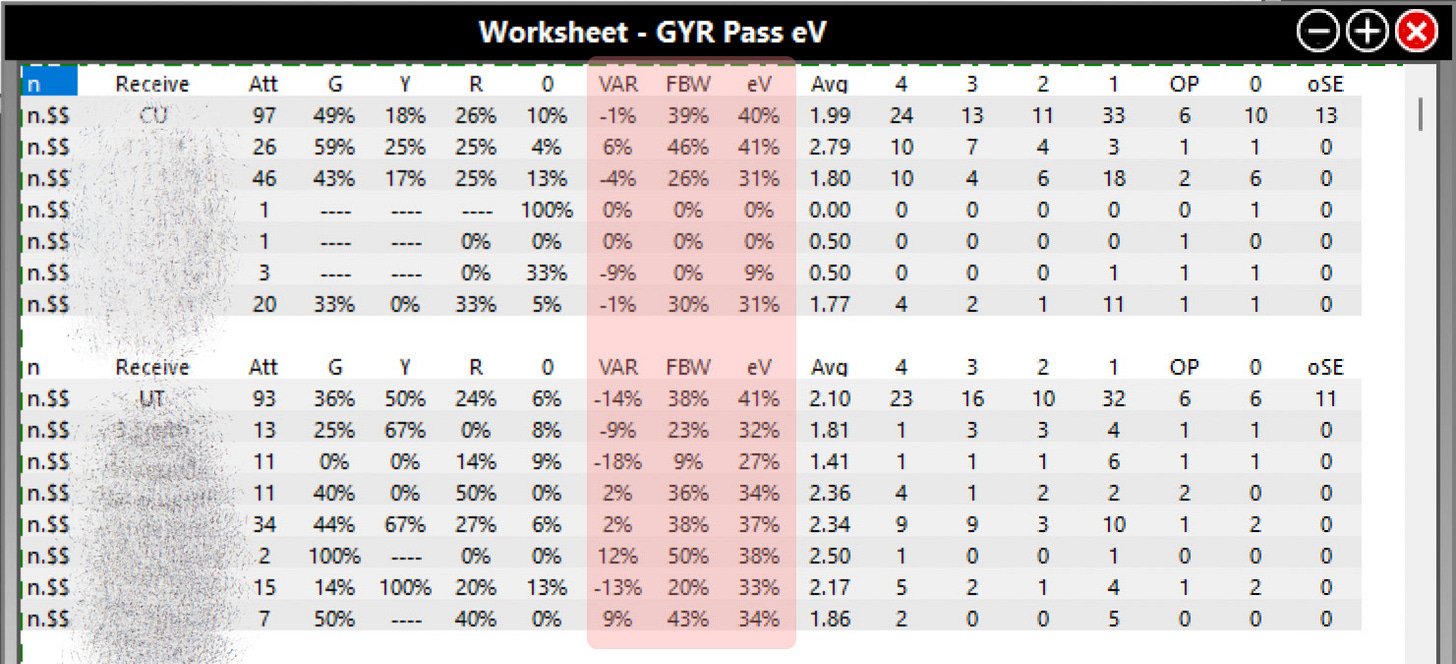
I have built a DV workup for reception eV with slightly different titles for the calculations that I can use during competition to get an idea of how players are performing relative to expectation. As I indicated above, this can be modified for any skill. While the highlighted calculations are basically the same, I used some different titles for them. VAR is Value Above Replacement, which is eV+. FBW is First Ball Win Percentage, which is FBSO%. Notice how much variance appears in VAR in data from only a single match.
I have also built a Tableau scatterplot with a reference line (not a regression line) to show how players’ eVs compare to their actual performances. Marks above the line indicate players who are outperforming their eVs so they have positive eV+ while marks below the line indicate players with negative eV+. This is designed to compare players using multiple seasons of data. This makes it easy for me to compare how current players compare to previous players in our program.
It is interesting to notice that eV and RW% (Rally Win %, same as SO% in this case) are not tightly correlated to reception averages, which are shown with the marks. There are three players with similar reception averages (2.19, 2.20, 2.20) that have similar eVs but in different order. Those values are all close enough together that the differences hardly matter. But notice how wildly different the RW% are, varying from less than 53% to greater than 59%. This data gives you a place to start asking questions that may inform how you train and compete. What makes their passes different from one another and how can you help your team side out better in each case? There’s almost more questions than answers here, which is important to consider.
One of my most important goals for Number Theory is not only to provide coaches with more ways to generate data but to share ideas around how and when to put the data to use in decision making. I hope that I’ve given you enough information to take Chad’s eV and make it your own. Chad would love it if “our sport can slowly turn the ship in that direction.” With that in mind, here are some parting ideas about underlying statistical concepts that you can keep in mind when experimenting with eV.
The hilarious Patton Oswalt has a standup comedy bit that includes the line, “We’re science: we’re all about coulda, not shoulda!” There are so many eVs that you could use but I encourage you to ask if you should. By all means, write the equations and generate conclusions, and then ask yourself if the conclusions you generated actually matter. Should they impact decision making? To me, there are two main factors that may give me concerns about using any conclusion I generate, how much data was used to create it and how large the effect the conclusion shows. The larger my sample size, the more confident I can be about the conclusions I draw from the sample. Statisticians represent that idea like this (from a phys.org article).
When you add more details to an eV situation, you slice your data thinner and thinner with each detail, which effectively decreases your sample size and increases the margin of error. So, assuming a fixed sample size, the more detailed your eV is, the less accurate its prediction will be.
My second factor, how large the effect is, came up in my Tableau example. Most of the players in that plot have an eV between 55% and 56% and the rest have an eV between 53% and 54%. Despite how it appears on the plot, the difference between the two groups is not very large. How much effort would be required to bring the lower group in line with the upper group? Is that effort worthwhile for the potential benefit of about one point every two matches? But, as Chad pointed out, where you place that effort matters. If you focus on ace prevention, you could get much more return on your investment. This is where something Chad and I discussed becomes important.

Chad brought up the usefulness of thinking about your efforts as vectors with two elements you can manipulate, magnitude and direction. In the case I just described, a vector with a large magnitude in one direction (a lot of effort into improving R!s into R#s) will yield a smaller result than a vector with the same magnitude in a different direction (a lot of effort into improving R=s and R/s into R-s). Chad communicates this to players by saying that they’re not just playing pickup basketball, where the emphasis is on highlight reels and looking good. He’s trying to win, and that means putting energy into different things. The perspective that eV can give you might not change the amount of energy you spend on certain things, but it should almost certainly change the direction that the energy goes in.
P.S. Given that sample size and quality have large effects on eV accuracy, Chad is excited about the advent of player tracking and deep learning use in volleyball. So much of eV is dependent on accurate location data, which is currently difficult and time-intensive to obtain. Having large numbers of matches with granular data about player and ball location for computers to store and analyze will ultimately help coaches better inform their expectations in ways that are so difficult to do at present.
Have questions for Chad? You can ask me here or you can email him directly.


